Put the Compare Tool to Work for You
The Compare tool allows three different photometric files to be evaluated and compared on a side by side basis with user defined criteria. With Compare in your arsenal you can easily discern performance differences between competitive luminaires or simply have better data to judge the best solution for your application.
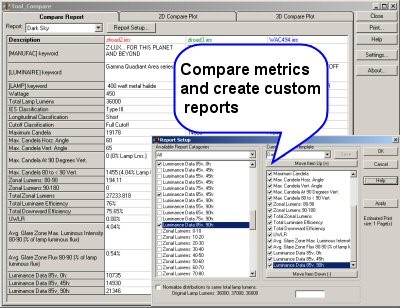
- Create customizable reports that contain any combination of calculated metrics and extracted photometric data from Photometric Toolboxs’ Indoor, Roadway and Flood reporting tools. The factory provided report includes metrics associated with exterior light pollution concerns. The Compare Tool comes with standard report formats including a “Dark Sky” format that includes the most relevant photometric metrics currently considered for performance evaluation with night skies, glare and trespass.

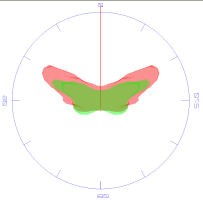
- Visualize the overlapping candela distributions using 2D horizontal cones and vertical planes
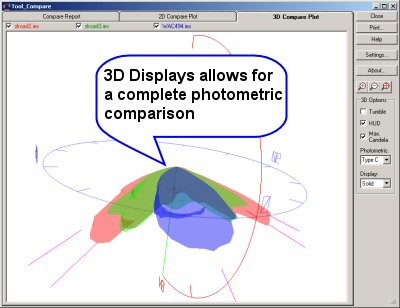
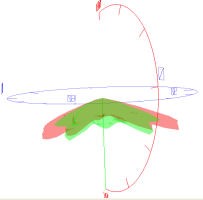
- 3D transparent photometric webs provide a better understanding of how the luminaire distributions differ.

- Normalize the lamp lumens for the selected luminaires to get an apples to apples comparison or to correct for inaccurate lumen specification.
- Print your reports including specifiable polar plot comparisons.
Are they really equal?
Photometric Toolbox allows you to evaluate and compare up to three different photometric files on a side by side basis with user-defined criteria. Compare is delivered with standard report formats including a “Dark Sky” format that includes the most relevant photometric metrics currently considered for performance evaluation with night skies, glare and trespass.
See a sample report from the Compare Tool
Visualize with graphic overlay
The Compare Tool also includes overlay capability for 2D polar candela graphs and 3D wireframe or solid format light distribution representations. The 3D overlay offers an intuitive way to visualize the difference in intensity at various angles.


